SAP change intelligence: Everything you need to know
In this guide, we’ll break down the key points you need to know...
The cloud is complex, dynamic, and hyper fast. Unfortunately, cloud environments are also growing in complexity so quickly that they’re exceeding the capacity of the human brain to manage.
New microservices-based applications that self-heal when components fail and that provision additional copies of themselves in response to increased demand are driving this complexity. We can no longer manage or monitor these dynamic environments in real-time using traditional monitoring techniques.
What does it even mean from a quality assurance perspective when an application microservice fails, but the application infrastructure automatically remediated the failure? The business process was still successful, so was this even a failure? These and similar questions are driving a new generation of AI-powered deterministic engines to monitor and triage these complex environments.
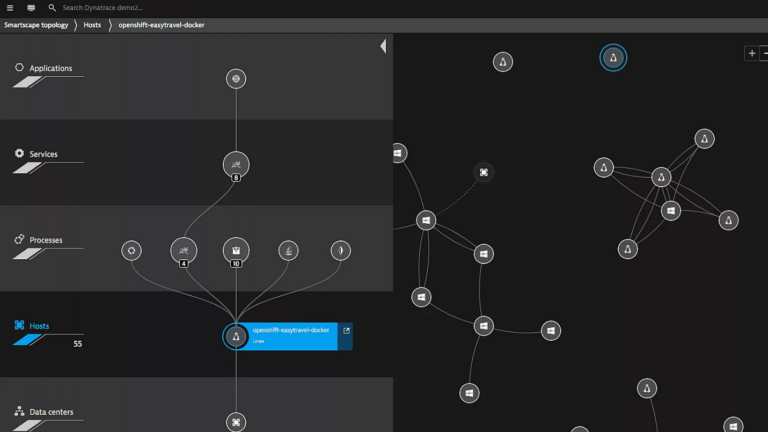
The simple truth is that prior to release into production environments, the ability to understand the performance characteristics of an application are sharply limited, because there are no production users. Using NeoLoad by Tricentis, we can simulate hundreds, thousands, or even millions of production users in the context of a performance test.
By leveraging the existing and seamless integration between the Dynatrace monitoring solutions and NeoLoad, we are now an active participant in the Cloud Automation story, allowing new builds to be automatically performance tested to simulate production-level traffic, and expose any weaknesses that may exist prior to release into a production environment. NeoLoad and Dynatrace have a long history of collaboration and integration, and your performance test data can be viewed in both NeoLoad reports as well as within the Dynatrace platform. This ensures that the stakeholders interested in reviewing the data can do so in their solution of choice.
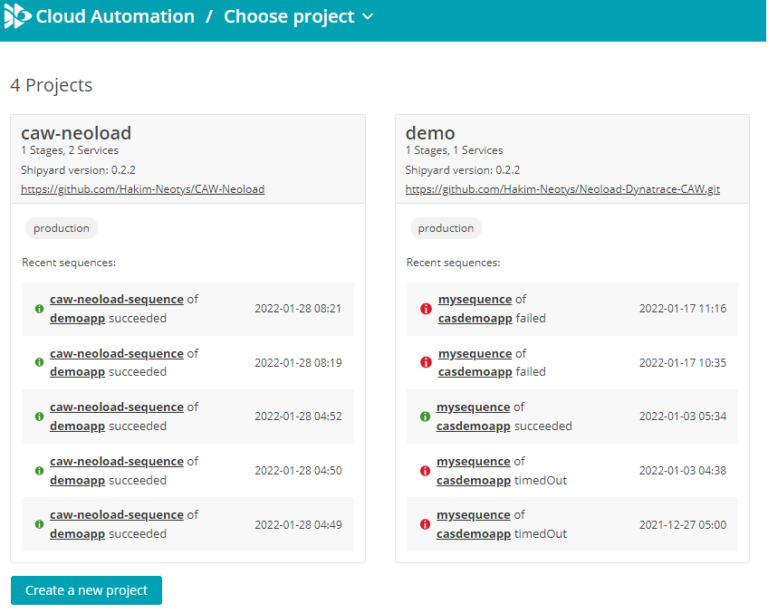
First, you’ll need to sign up for a free trial of Cloud Automation from Dynatrace. This will provide the dashboard and reporting views of your project and allow you to see how a sequence stage can automatically trigger a performance test.
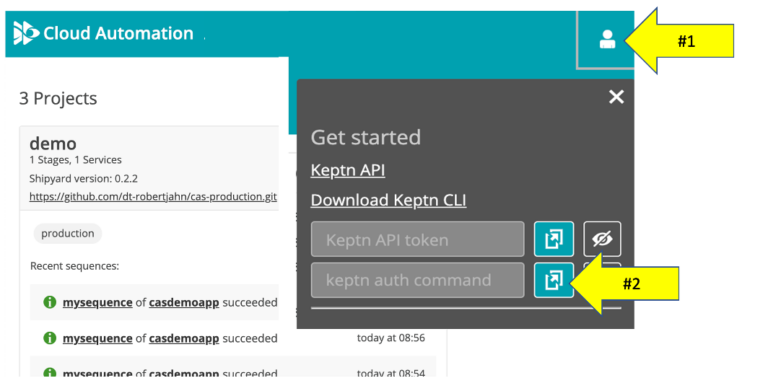
Once inside your trial, you’ll be able to setup and configure new projects. First, however, you’ll need to get Keptn setup and configured!
curl -sL https://get.keptn.sh | KEPTN_VERSION=0.10.0 sudo -E bash
If you are not running Keptn within your own Kubernetes environment, you will probably want to suppress Keptn CLI messages related to kubectl configuration. Basically, you don’t want to hear a lot of Keptn noise about your Kubernetes instance if you don’t have one! Do that with this command:
keptn set config KubeContextCheck false
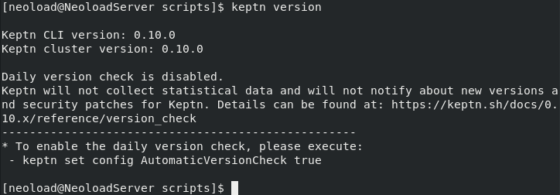
Now run the version command to make sure everything is installed properly:
keptn version
NeoLoad is a world-class load and performance testing solution. Using a code-less test design to rapidly allow users to create performance tests, while also supporting tests-as-code for integration into pipelines for CI/CD solutions, NeoLoad provides a comprehensive ability to execute load and performance tests against your system.
To trigger a performance test within your Cloud Automation project, you will need to invoke NeoLoad. You can start a free trial of NeoLoad here, and be up and running within five minutes.
Once you have a NeoLoad SaaS environment, you can create a simple test by downloading the Controller component here.
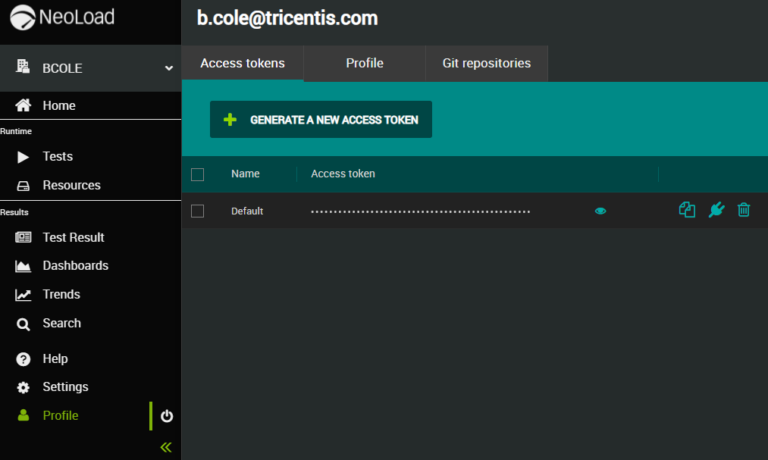
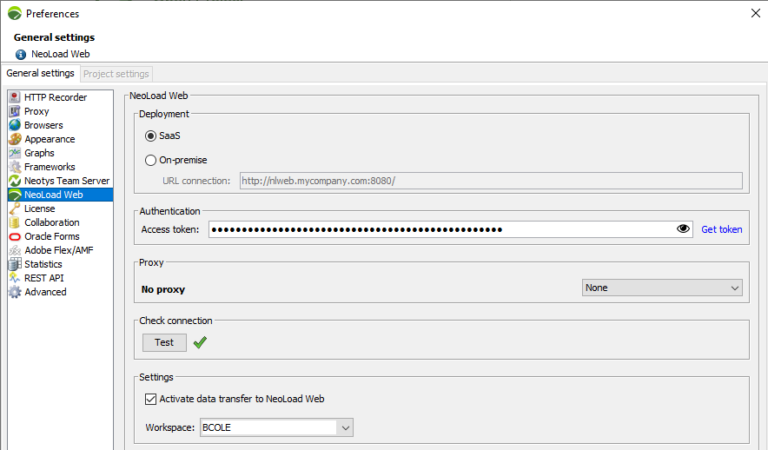
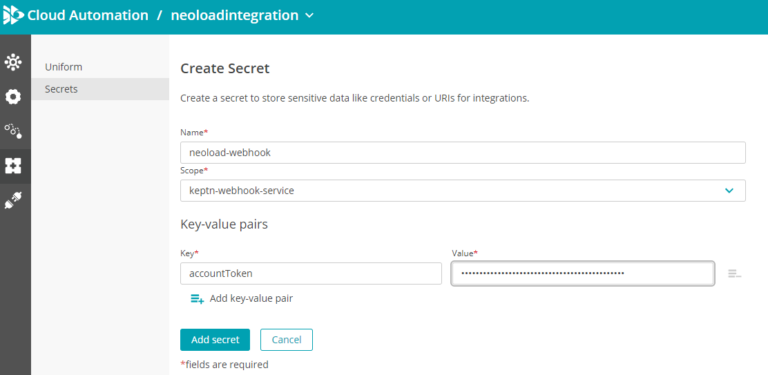
The Controller lets you create new user paths and execute them by leveraging NeoLoad SaaS. To do this you will need an access token from NeoLoad SaaS. You’ll find this when you click on the Profile link at the bottom of the screen. Generate a new token and copy the value to the clipboard.
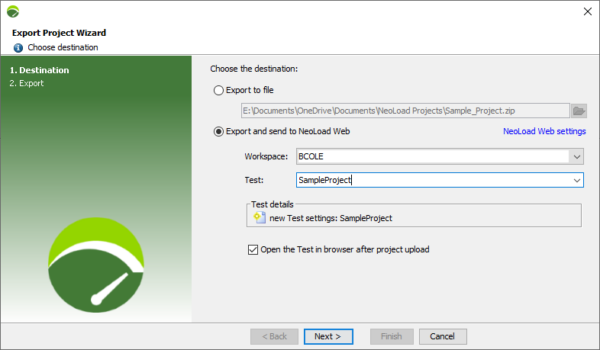
If you’re new to performance testing, in the NeoLoad Controller simply open the Sample Project that ships with the product. Then select File –> Export Project to NeoLoad Web… to upload it into your SaaS account.


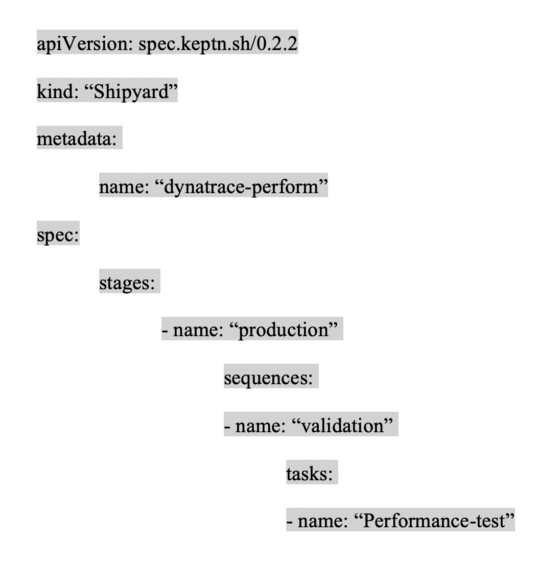
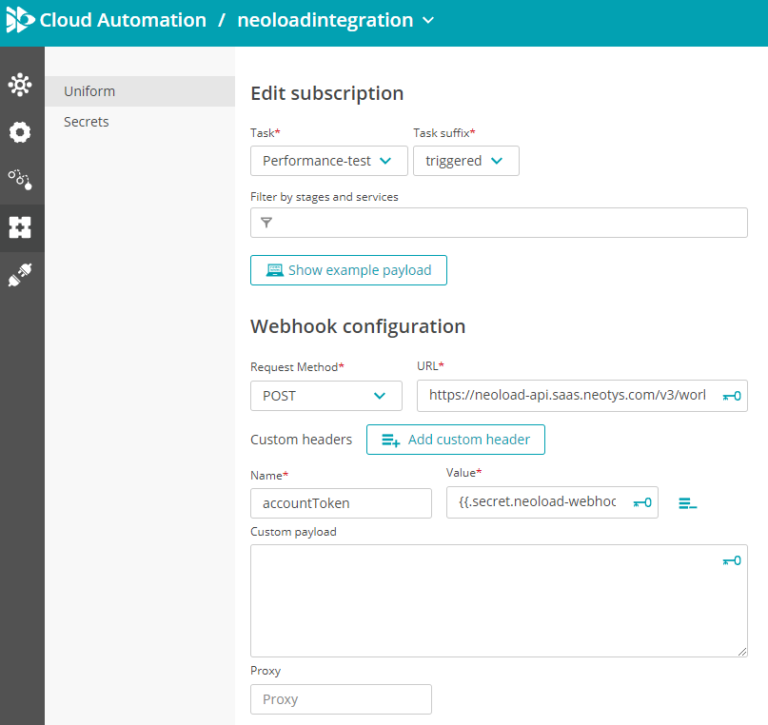
Task: Performance-test
Task suffix: triggered
In the Webhook configuration form section fill out the following:
Request Method: POST
URL: https://neoload-api.saas.neotys.com/v3/workspaces/<Your WorkspaceID>/tests/<Your TestID>/start?testResultName=Demo-test-result&testResultDescription=stage-{{.data.stage}}
Add a header:
name: accountToken
value: {{.secret.neoload-webhook.accountToken}}
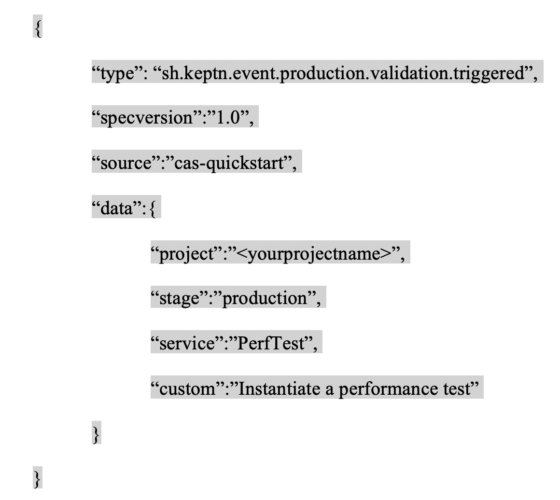
keptn send event -f mysequence-triggered.template
The template file outlines the scope of the event being triggered, and is included below. Make sure you change the project entry <yourprojectname> to the value you created within Cloud Automation!
The short answer is yes, you could. Like any software solution, both Jenkins and other CI systems have some overlap with what Cloud Automation is doing here. You’d just need to code in support for automatic deployments, triggered monitoring, and the dozens of other tasks that Cloud Automation is doing in the background to manage the deployment and release trains as they move into different environments.
Possible doesn’t always mean best! If you can use a solution fit for purpose that doesn’t require you to write dozens, hundreds, or even thousands of lines of code, that also offers more functionality and capability, we encourage you to take advantage of it!
We hope that you found this interesting and useful, and encourage you to reach out to both your Dynatrace and Tricentis contacts to continue to learn more about our strong partnership. NeoLoad performance test results can be viewed directly in the Dynatrace platform itself, and Dynatrace data can be viewed within the NeoLoad analysis reporting. The goal is to ensure rapid and highly performant code being delivered to production, and our joint partnership allows you to view performance data and metrics in your platform of choice.
In this guide, we’ll break down the key points you need to know...
See Tosca’s latest cloud capabilities, from advanced test...
Implement 3 smart quality gates to achieve zero defects in...
Discover how you can keep pace with Salesforce innovation while...
Get an exclusive first look at NeoLoad 2025.1: New UI, extended...